BART Safety Compared To Other Transit Systems
I've been riding the Bay Area Rapid Transit (BART) for around 20 years. Being able to use BART allows me to not own a car, which I love. Like everyone, I have complaints about BART, but overall I'm happy with the system.
The other day I saw a commercial for an investigation that NBC news did about how dangerous BART has become. The segment looked like gross sensationalism and fear-based reporting. Because the commercial was so bad, I have not bothered to watch the report.
I did want to see how BART actually compared to other transit systems in the United States. I presumed that the crime rate on BART would be similar to that of other systems, like the New York Subway.
My presumptions seemed to have been wrong. It does look like BART is more dangerous than other major transit systems in the US.
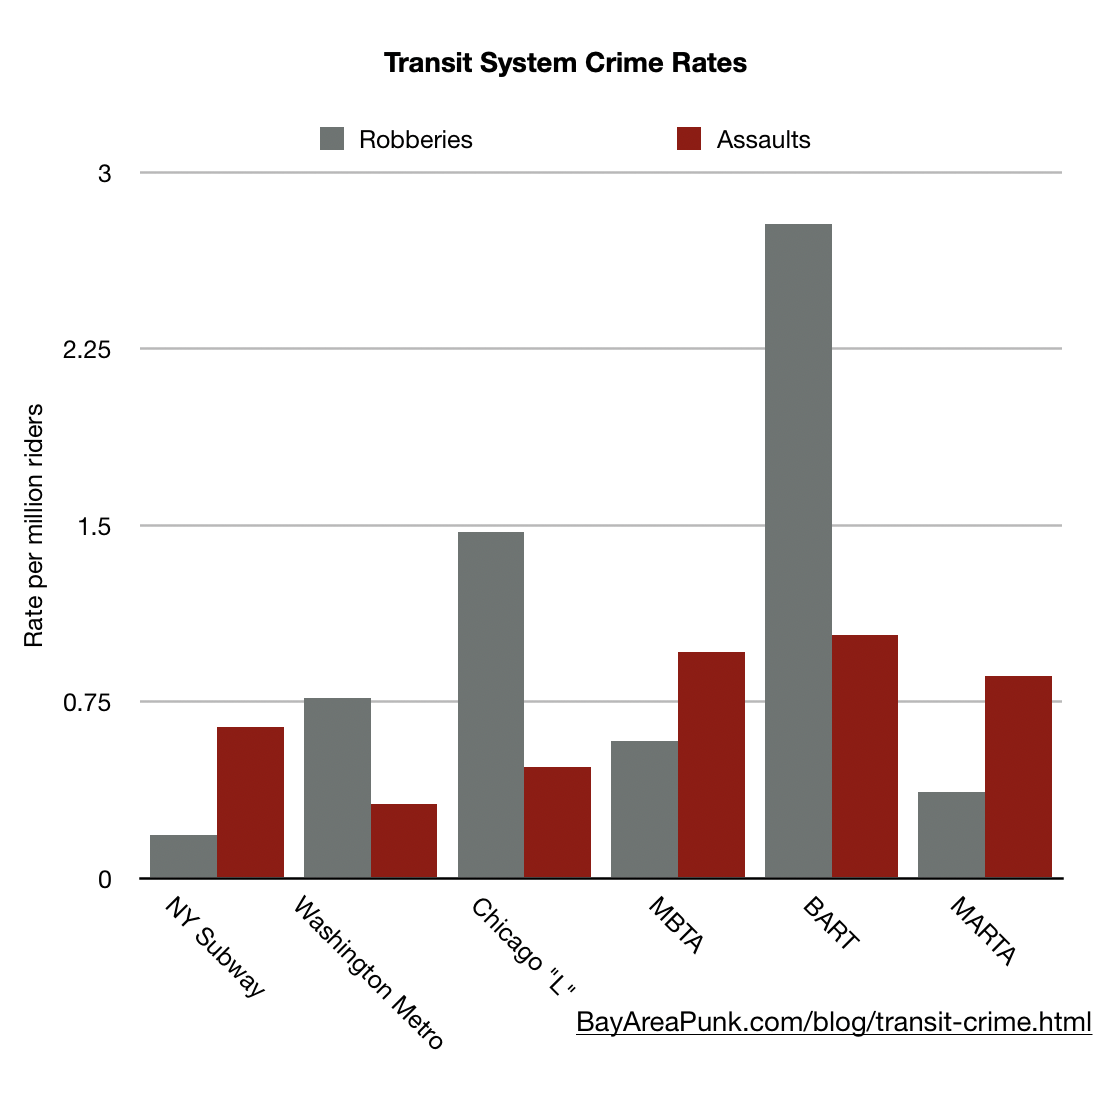
Comparing Transit Crime Rates
What I wanted to do was see how much violent crime there is per one million riders on a transit system. There are other ways to track crime data. SF MUNI tracks crime rate per 100,000 miles traveled.
Two forms of crime that seem to be commonly tracked by transit systems are robberies and assaults. These are violent crimes and are a good measure of safety on a transit system.
Unfortunately, the crime data I found is not a one-to-one comparison. Different states have different laws and definitions of crimes.
For example, BART tracks "aggravated assault", which can be charged as a felony or misdemeanor in California. The New York Subway tracks "felony assault" and also "assault 3 and related offenses". Chicago has statistics about aggravated assaults and also aggravated battery, which is not a static in the other transit systems. I went ahead and included all of these in the "assault" category.
It seems like all the crime data I found keeps track of robberies, but again, the same act might be labeled a robbery in one state and something else in another.
Another problem with this data is that some transit systems do not separate their crime data between heavy rail and the rest of the system. MARTA has crime data for the whole system, including buses. The rail system is only about half the ridership of MARTA, but because I was not able to find the data for MARTA rail, I had to look at the ridership total for the whole system, including buses. Same for the Washington Metro, where two thirds of the ridership there is the rail system. When possible, I only looked at the crime data for heavy rail systems which compares more directly to BART, which is a heavy rail system.
The ridership data all comes from a single source, so should be a reliable comparison, though as mentioned above, I had to include more than just heavy rail ridership for a couple of the transit systems.
BART Seems To Be Less Safe
BART does seem to be less safe than other transit systems, especially in terms of robberies. The amount of violent crime on BART has more than doubled since 2014. Chicago's "L" has seen a similar increase, but the other transit systems have seen a decrease in crime.
Though tracked in a different way, crime on MUNI has been steadily going down over the last five years.
| System | City | Robberies | Assaults | Ridership (millions) | Robberies per million | Assaults per million |
|---|---|---|---|---|---|---|
| New York City Subway | New York | 484 | 1685 | 2,629 | 0.184 | 0.641 |
| Washington Metro | Washington DC | 257 | 106 | 335 | 0.766 | 0.316 |
| Chicago "L" | Chicago | 332 | 107 | 225 | 1.470 | 0.474 |
| MBTA | Boston | 91 | 150 | 155 | 0.584 | 0.963 |
| BART | San Francisco | 349 | 130 | 125 | 2.779 | 1.035 |
| MARTA | Atlanta | 42 | 99 | 115 | 0.365 | 0.859 |
Data Sources
Crime statistics:
https://www.wmata.com/about/transit-police/upload/Five-Year-Crime-Report-2014-2018.pdf
Ridership statistics:
https://www.apta.com/wp-content/uploads/2018-Q4-Ridership-APTA.pdf
Unfortunately I could not find any crime statistics for Philadelphia's SEPTA system.