Police Spending In The Bay Area
The recent black lives matter protests have inspired a call to defund the police. The city of Minneapolis has voted to dismantle its police department. Portland's chief of police has resigned after only six months in office. A handful of officers are actually being charged with violence against protesters. And the amazing thing is that these protests are continuing and growing in numbers every day.
The calls to defund the police made me wonder just how much tax payer money is being spent on police departments in the Bay Area. I did a little bit of research and found some really interesting discrepancies in the amounts of money different cities spend on policing their citizens. In the end I was shocked at how much some cities spend on their police departments instead of using that money for schools, homeless shelters, or community programs.
Where To Find Police Spending Data
Cities publish their budget in an annual report. These budget reports include revenue and expenditures for that year, along with data for the past few years. If you search Google for 'CITY_NAME general fund expenditures' the first result is usually a PDF file with the budget report. These reports are hundreds of pages long, and most have an 'expenditures by department' section. That section is where you want to look to see how much money is being spent on that city's police department.
A few cities, like Sunnyvale seem to lump the fire and police departments together in their budget report, which is unfortunate. Others break down their expenditures in a more detail than just 'police spending'. However, most seem to simply have a 'police' expenditure and clearly state how much is spent on their police.
Most of the reports I found were for the 2020 fiscal year. Because 2020 is not yet over, many of these reports were projections. It's not uncommon for police officers to schedule so much overtime that they always overspend their projected budget, so the actual amounts spent may differ from the projections.
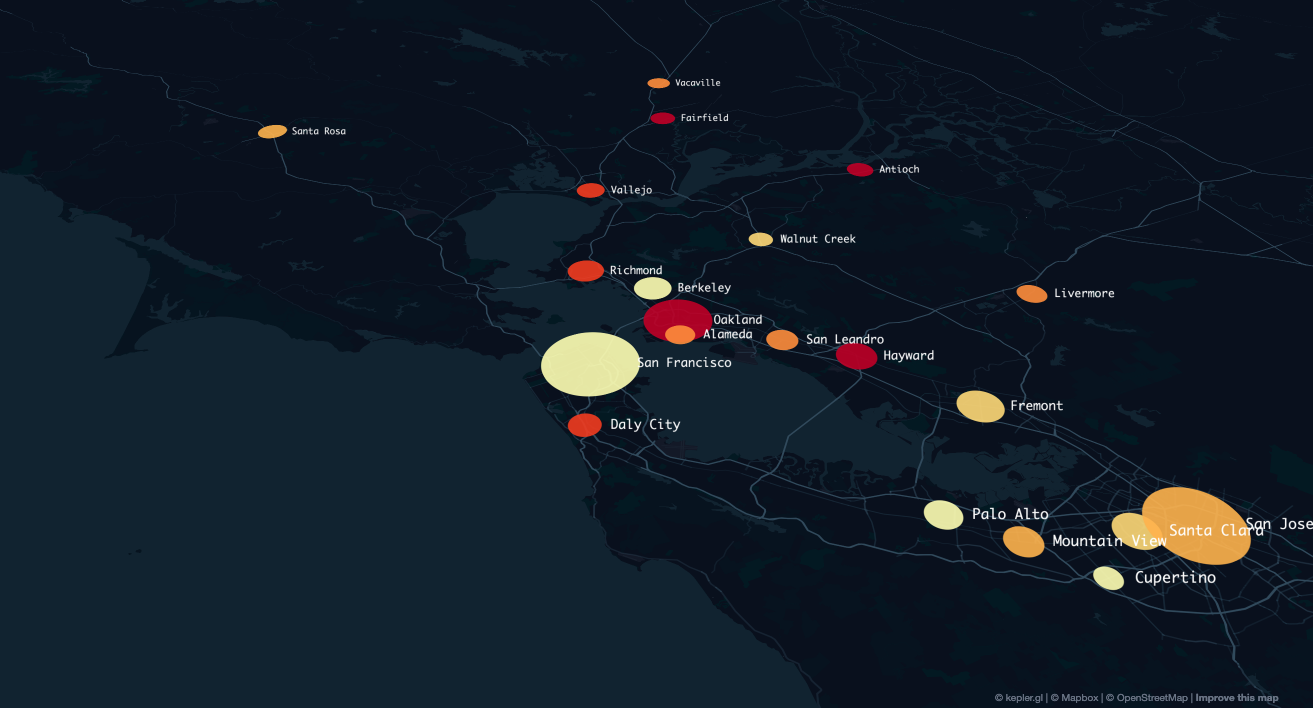
I gathered data for about 20 different cities in the Bay Area, and compared their police spending. I did not include spending on the San Francisco Sherifs Department and other spending items which were not explicitly labeled as 'police'.
Cities With The Most Expensive Police Departments
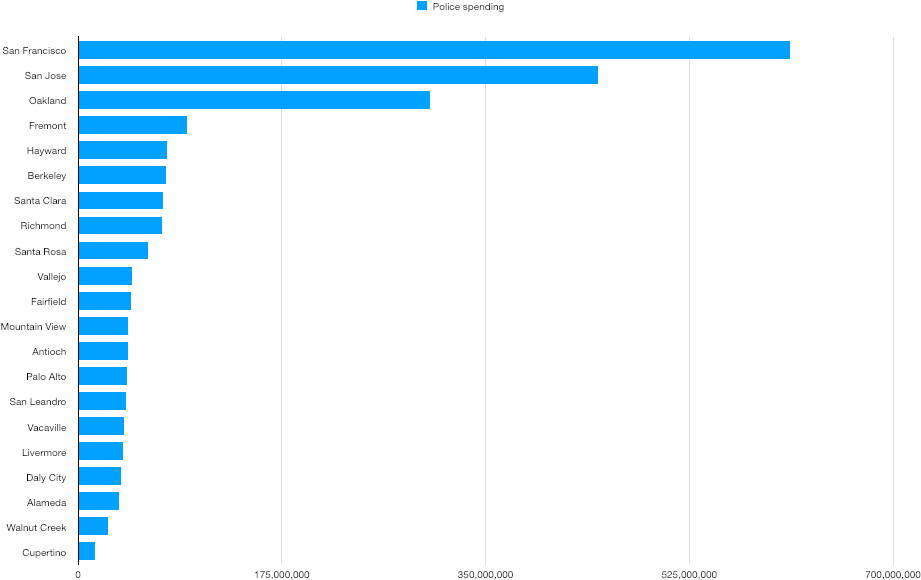
It's not too surprising that the cities with the largest populations spent the most money on their police departments. I was a bit surprised at how little Cupertino spends on their police department. I imagined that a city whose median household income is $134,872 would spend more on protecting all that wealth.
Police Spending Per Resident
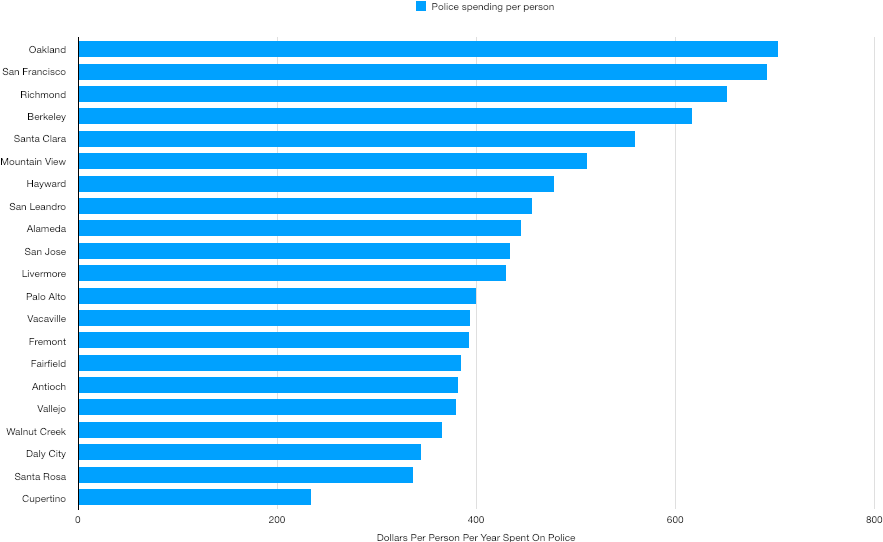
The amount of money spent on police divided by the population of each city (2018 numbers) is more interesting.
I assumed there would be a strong correlation with the wealth of a city. A wealthy city should spend more per person on police, just because a wealthy city collects more taxes and can afford to spend more money all public goods and services.
That's actually not the case. Cities like Cupertino and Walnut Creek are near the bottom of the list. Oakland, Richmond, and Hayward are all near the top of the list. It seems like the wealth of a city does not have much to do with the funding of its police department.
Police Spending As Percent Of City Budget
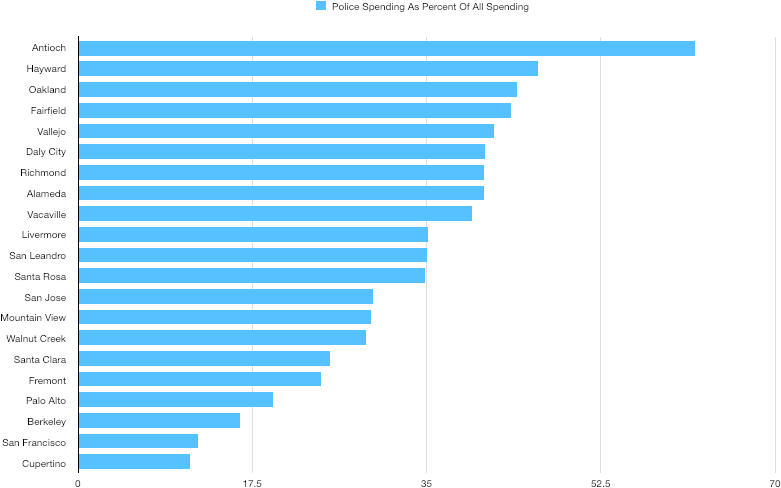
I think this is the most interesting graph. It shows what percent of a cities budget is spent on police. Berkeley spends a lot of money per citizen on its police department, but it actually spends relatively little on its police department compared to the rest of its budget.
Antioch shockingly spends over 60% of its annual budget on police. That's completely insane.
Hayward, Oakland, and Fairfield are not a lot better. All three cities spend over 40% of their budgets on police.
For me, these numbers really bring home the idea that we should consider defunding the police. To spend over 40% of all the services a city government provides on policing the citizens of that city seems like a gross misallocation of funds.
The Data
For anyone who is interested, here is a comma separated version (CSV) of the numbers I collected, including the sources:
City,latitude,longitude,Population,Police spending,Total spending,Police spending percent,Budget source,Police spending per person Oakland,37.8044,-122.2712,"429,082","301,809,379","684,546,119",44.0889767136347,https://cao-94612.s3.amazonaws.com/documents/FY-2019-21-Adopted-Budget-Policy-Book-FINAL-WEB-VERSION.pdf,703.383919623755 San Francisco,37.7749,-122.4194,"883,305","611,000,000","5,062,800,000",12.0684206368018,https://sfgov.org/scorecards/finance/expenditures-and-revenues-vs-budget,691.720300462468 Richmond,37.9358,-122.3477,"110,146","71,811,039","176,208,965",40.7533402173947,https://www.ci.richmond.ca.us/DocumentCenter/View/51243/Adopted-FY2019-2020-Operating-Budget,651.962295498702 Berkeley,37.8715,-122.2730,"121,643","74,979,834","460,146,093",16.2947887943927,https://www.cityofberkeley.info/uploadedFiles/Manager/Budget/FY-2020-2021-Adopted-Budget-Book.pdf,616.392509227822 Santa Clara,37.3541,-121.9552,"129,488","72,448,536","286,652,758",25.2739713741041,https://www.santaclaraca.gov/home/showdocument?id=65838,559.5 Mountain View,37.3861,-122.0839,"83,377","42,652,270","144,970,342",29.4213764081484,https://www.mountainview.gov/civicax/filebank/blobdload.aspx?BlobID=30498,511.559182988114 Hayward,37.6688,-122.0810,"159,620","76,321,947","165,218,629",46.1945166001831,https://www.hayward-ca.gov/sites/default/files/Proposed%20FY%202019%20-%20Final%20-%20Copy.pdf,478.147769703045 San Leandro,37.7258,-122.1569,"89,703","40,914,566","116,789,566",35.0327237280769,https://sanleandro-my.sharepoint.com/personal/sperez_sanleandro_org/_layouts/15/onedrive.aspx?id=%2Fpersonal%2Fsperez%5Fsanleandro%5Forg%2FDocuments%2FCity%20Final%20Council%20Adopted%20Biennial%20Budget%20Document%2006%2D26%2D19%2Epdf&parent=%2Fpersonal%2Fsperez%5Fsanleandro%5Forg%2FDocuments&originalPath=aHR0cHM6Ly9zYW5sZWFuZHJvLW15LnNoYXJlcG9pbnQuY29tLzpiOi9nL3BlcnNvbmFsL3NwZXJlel9zYW5sZWFuZHJvX29yZy9FY01ScUo3QklRQk90RUVDNVFhVUh4c0JoNnBmcHg4SktTRW9lWi0tTFJkVjFRP3J0aW1lPTJfa1FFRnNMMkVn,456.111456695986 Alameda,37.7799,-122.2822,"78,338","34,851,000","85,542,000",40.7413901942905,https://www.alamedaca.gov/files/assets/public/02._general_fund_combined_1.pdf,444.879879496541 San Jose,37.3382,-121.8863,"1,030,000","446,810,786","1,510,135,437",29.5874644785254,https://www.sanjoseca.gov/home/showdocument?id=44702,433.79687961165 Livermore,37.6819,-121.7685,"90,269","38,782,873","110,276,257",35.1688333056136,http://www.cityoflivermore.net/civicax/filebank/blobdload.aspx?t=50552.15&BlobID=19509,429.63667482746 Palo Alto,37.4419,-122.1430,"105,025","41,951,000","213,996,000",19.6036374511673,https://www.cityofpaloalto.org/civicax/filebank/documents/64861,399.438228993097 Vacaville,38.3566,-121.9877,"100,154","39,460,267","99,847,163",39.5206692051931,https://www.ci.vacaville.ca.us/home/showdocument?id=13809,393.995916288915 Fremont,37.5485,-121.9886,"237,807","93,307,000","382,856,000",24.3713040934451,http://www.fremont.gov/FY19-20ProposedOperatingBudget,392.364396338207 Fairfield,38.2492,-122.0405,"116,884","44,929,507","103,235,966",43.5211765248557,https://www.fairfield.ca.gov/civicax/filebank/blobdload.aspx?blobid=17664,384.393988912084 Antioch,38.0049,-121.8058,"111,535","42,602,339","68,732,357",61.9829449468756,https://www.antiochca.gov/fc/finance/Adopted-Budget-2019-21.pdf,381.963858878379 Vallejo,38.1041,-122.2566,"121,913","46,323,975","110,865,319",41.7840091183069,https://cityofvallejo.net/common/pages/DisplayFile.aspx?itemId=15617774,379.975679377917 Walnut Creek,37.9101,-122.0652,"69,825","25,527,005","88,200,891",28.9418901675268,https://www.walnut-creek.org/home/showdocument?id=17288,365.585463659148 Daly City,37.6879,-122.4702,"107,008","36,873,842","90,292,870",40.8380440227451,http://www.dalycity.org/Assets/Departments/Finance+and+Administration/Operating+Budget+2019-2020.pdf,344.589582087321 Santa Rosa,38.4404,-122.7141,"177,586","59,700,000","171,300,000",34.8511383537653,https://srcity.org/DocumentCenter/View/25613/FY-2019-20-Budget-at-a-Glance,336.175148941921 Cupertino,37.3230,-122.0322,"60,170","14,077,937","124,857,233",11.275227443171,https://www.cupertino.org/home/showdocument?id=24872,233.969370117999